
AI-Powered Deal Analysis for Institutional Investors
AI-Powered
Deal Analysis for Institutional Investors
See how leading VCs, PEs, and family offices are using predictive intelligence to enhance their deal evaluation process, backed by analysis of 600,000+ venture transactions.

Only spend your time on the most promising deals in your pipeline.
Only spend your time on the most promising deals in your pipeline
Score companies early in your deal
pipeline to better allocate time and
resources on companies that are likely
to be the most successful.
Score companies early in your deal pipeline to better allocate time and resources on
companies that are likely to be the most successful.
Imagine getting a predictive score on
every deal that comes into your pipeline?
Imagine getting a predictive score on every deal that
comes into your pipeline?
Use Hatcher Score to screen & score every deal that comes
into your pipeline. 650 is average, everything above is
considered above average. Invite founders to fill in information
directly about their profile, upload your own deals, and pull in
data from public third parties.
Use Hatcher Score to screen & score every deal that comesinto your pipeline. 650 is average, everything above is considered above average. Invite founders to fill in informationdirectly about their profile,
upload your own deals, and pull in
data from public third parties.
Want to learn more about our
score? Read More
Want to learn more about our score? Read More


Hatcher Score
The Hatcher Score is a composite score which serves as an overall predictive metric for
evaluating a startup's potential success.

Return Potential Score
The Return Potential Score predicts the
potential valuation multiple if a firm continues to operate into the future, based on past data.

Exit Potential Score
The Exit Potential Score predicts how likely a company is to be successfully sold or go public (IPO).
Hatcher Score
The Hatcher Score is a composite
score which serves as an overall
predictive metric for evaluating a
startup's potential success.
Return Potential Score
The Return Potential Score predicts
the potential valuation multiple if a
firm continues to operate into the
future, based on past data.
Exit Potential Score
The Exit Potential Score predicts
how likely a company is to be successfully sold or go public (IPO).

Funding Potential Score
The fundraising potential score predicts how
likely a company is to get funding based on companies in a similar industry.

Venture Trend Score
The Venture Trend Score predicts how popular
a company's theme and industry is in the
venture world (given geography, etc). It
attempts to distinguish trending concepts for the region.

Impact Readiness Score
This is a score used to measure how likely a company is to have investors with social and environmental investment policies (e.g., Impact, SDG, ESG).
Funding Potential
Score
The fundraising potential score
predicts how likely a company is to
get funding based on companies in
a similar industry.
Venture Trend Score
The Venture Trend Score predicts
how popular a company's theme and industry is in the venture world
(given geography, etc). It attempts to distinguish trending concepts for the region.
Impact Readiness
Score
This is a score used to measure how likely a company is to have investors
with social and environmental
investment policies (e.g., Impact,
SDG, ESG).

Geographic Potential Score
The Geographic Potential Score shows how
good a company's location is for venture
success, compared to the current market
trends. The geographic potential score is also
used to "weigh" the commentary generated as
part of the comparative analytics module.

CEO Fundraising Score
The CEO Fundraising Score estimates if a CEO will be good at raising money for their company.
It looks at the CEO's life story, experience, and how they stand compared to other CEOs. This score is useful for showing how likely a CEO is
to raise funds, helping both investors and
company founders.

CEO Exit Potential Score
This predicts how likely it is for a CEO to successfully sell or IPO their company. It looks
at the CEO's life story, experience, and how
they compare to other CEOs. This score helps investors decide if a CEO is good at creating an exit their company.
Geographic Potential
Score
The Geographic Potential Score shows how good a company's location is for venture success, compared to the current market trends. The geographic potential score is also used to "weigh" the commentary generated as part of the comparative analytics module.
CEO Fundraising Score
The CEO Fundraising Score
estimates if a CEO will be good at
raising money for their company. It
looks at the CEO's life story,
experience, and how they stand compared to other CEOs. This score
is useful for showing how likely a
CEO is to raise funds, helping both investors and company founders.
CEO Exit Potential
Score
This predicts how likely it is for a
CEO to successfully sell or IPO their company. It looks at the CEO's life
story, experience, and how they
compare to other CEOs. This score
helps investors decide if a CEO is
good at creating an exit their
company.
Tools that help you manage and analyze your deal database
Tools that help
you manage and
analyze your deal database
Import deals via excel, invite founders to fill in their
company information, score companies, share companies
and more.
Import deals via excel, invite founders
to fill in theircompany information,
score companies, share companies
and more.
Dashboards to handle any number of deals
Dashboards to handle
any number of deals
Upload deals in bulk, or generate one-off secure links to invite companies to fill in their information for scoring consideration. Also share companies internally within
your firm, or request feedback from external sources.
Upload deals in bulk, or generate
one-off secure links to invite
companies to fill in their information
for scoring consideration. Also
share companies internally within
your firm, or request feedback from external sources.


AI-Powered Valuation Projections
AI-Powered Valuation
Projections
A rapid analysis of a company's potential valuation trajectory from early to
later rounds within its broader industry and geographic context. These
project valuation ranges in current dollars for similarly situated companies
that continue through later rounds. In addition to central prediction,
conformal prediction coverage bands are included. This helps understand
the potential valuation landscape for broadly similar successful firms.
A rapid analysis of a company's
potential valuation trajectory from
early to later rounds within its
broader industry and geographic
context. These project valuation
ranges in current dollars for
similarly situated companies that
continue through later rounds. In
addition to central prediction,
conformal prediction coverage
bands are included. This helps
understand the potential valuation
andscape for broadly similar
successful firms.

AI-Powered Valuation Percentile
AI-Powered Valuation
Percentile
Projected Valuation Percentile relative to similarly situated companies at the current funding round. The relative percentiles are noted with the firm’s latest or expected valuation highlighted.
Projected Valuation Percentile
relative to similarly situated
companies at the current funding
round. The relative percentiles are
noted with the firm’s latest or
expected valuation highlighted.

Read More About Hatcher+
Score's Products and Approach
Read More About Hatcher+ Score's Products and
Approach
Dive deeper into our AI/ML approaches and how we analyze companies
Dive deeper into our AI/ML approaches
and how we analyze companies
3 min
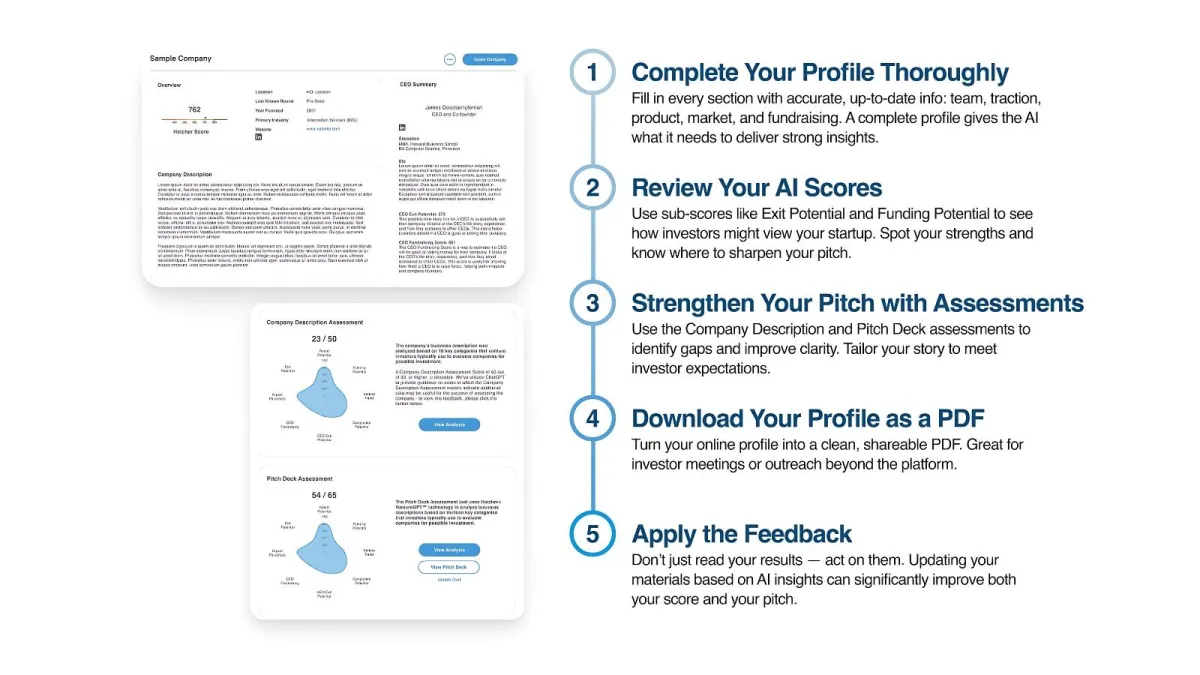
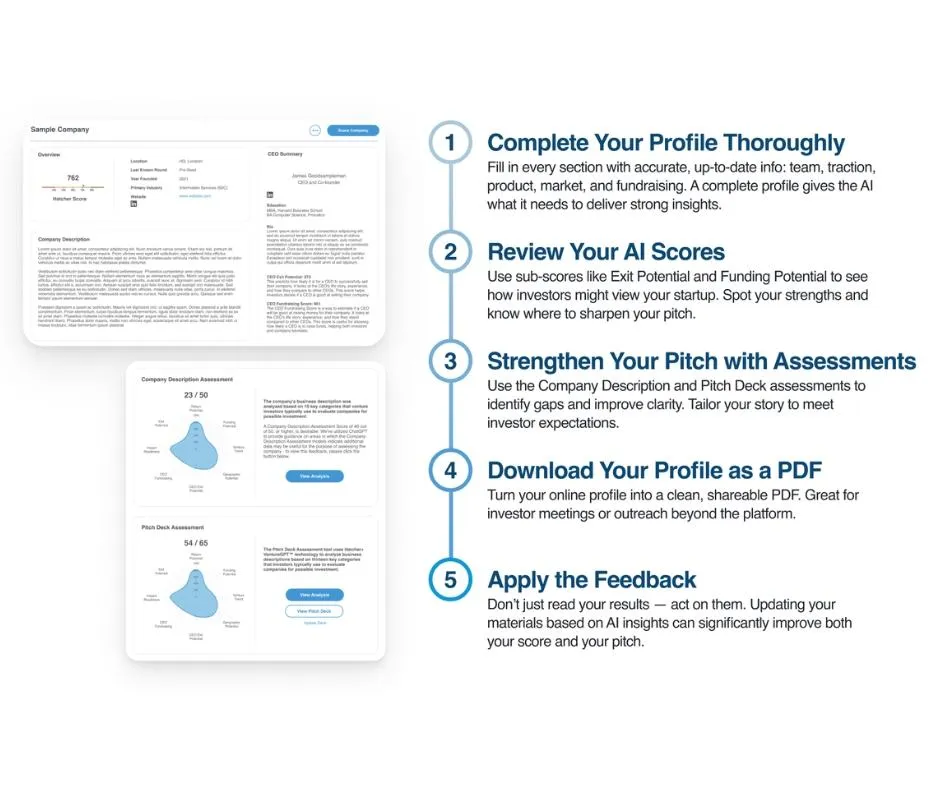
How to Get the Most Out of Your Hatcher Score Profile
How to Get the Most Out of Your Hatcher Score Profile
How to Get the Most Out of Your Hatcher Score Profile
Jun 19, 2025

3 min
Breaking Down the Component Scores
Feb 25, 2025
3 min
How to Get the Most Out of Your Hatcher Score Profile
How to Get the Most Out of Your Hatcher Score Profile
Jun 19, 2025

3 min
Breaking Down the
Component Score
Feb 21, 2025

Hatcher+Score is Al for
Founders: Elevate Your Start-
Up's Pitch and Funding
Prospects
Feb 21, 2025

Hatcher+Score: Data-Driven
Insights for Smarter Start-Up
Investments
Feb 21, 2025

Hatcher+Score's Valuation
Projection
Feb 20, 2025

Al Tools in Venture Capital:
How Al is Changing the
Game
Feb 12, 2025

Hatcher+Score Venture Data
Analysis & Forecasting
White paper 2020
Feb 26, 2025

Explore our comprehensive
24-month analysis of over
40,000 companies using
publicity accessible data
How to Get the Most Out of Your Hatcher Score Profile
Jan 26, 2025
3 min
Breaking Down the Component Scores
Feb 25, 2025
Hatcher+Score is AI for Founders: Elevate Your Start-Up’s Pitch and Funding Prospects
Feb 21, 2025
Hatcher+Score: Data-Driven Insights for Smarter Start-Up Investments
Feb 21, 2025
Hatcher+Score's Valuation Projection
Feb 20, 2025
AI Tools in Venture Capital: How AI is Changing the Game
Feb 12, 2025
Hatcher+ Score Venture Data Analysis & Forecasting White paper 2020
Jan 26, 2025
Explore our comprehensive 24-month analysis of over 40,000 companies using publicly accessible data
Jan 26, 2025
Accelerate Your Deal Analysis with AI-Powered Insights
AI-Powered
Deal Analysis for Institutional Investors
Experience smarter Deal Analysis with AI-driven tools that boost performance and save you time.
© 2025 Hatcher Plus Pte Ltd. All rights reserved.